Dashboards & Financial Automation

Your numbers, read in seconds — not compiled for hours.

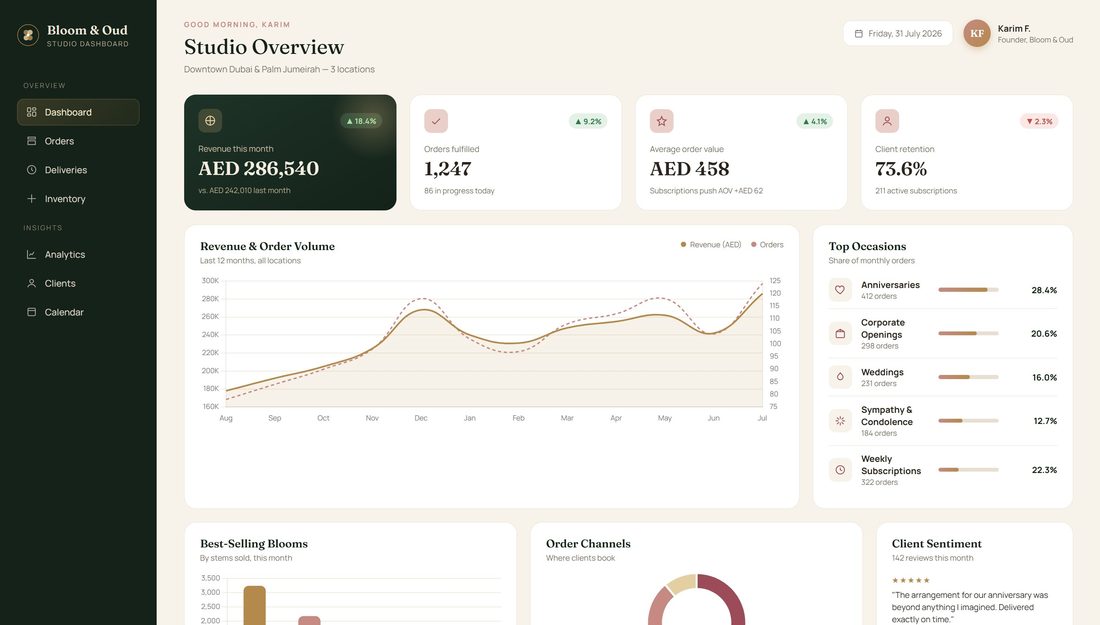
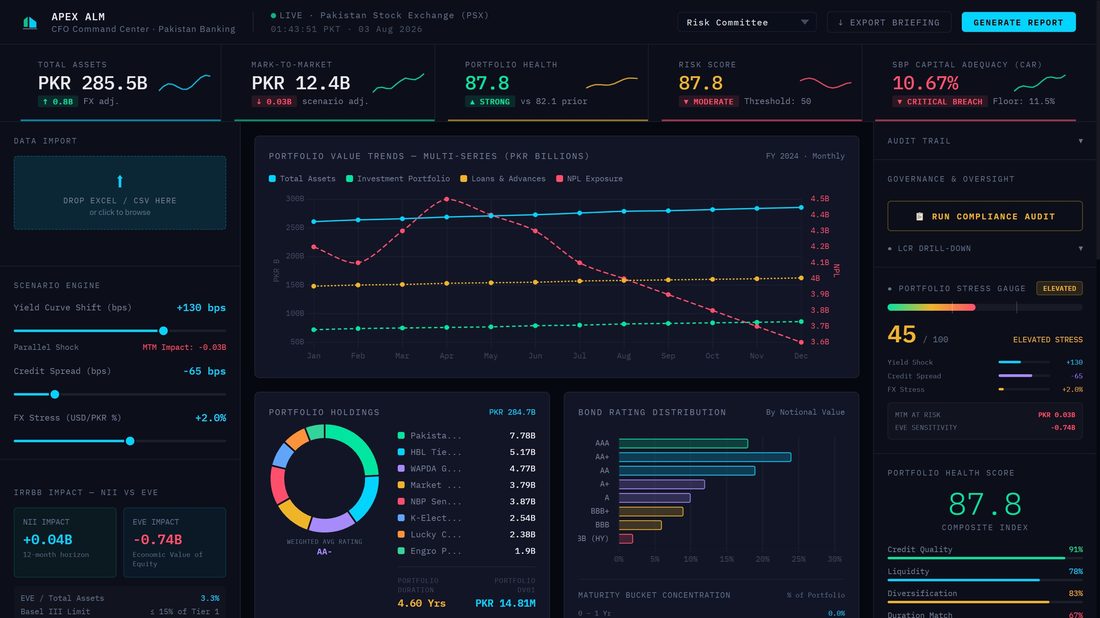
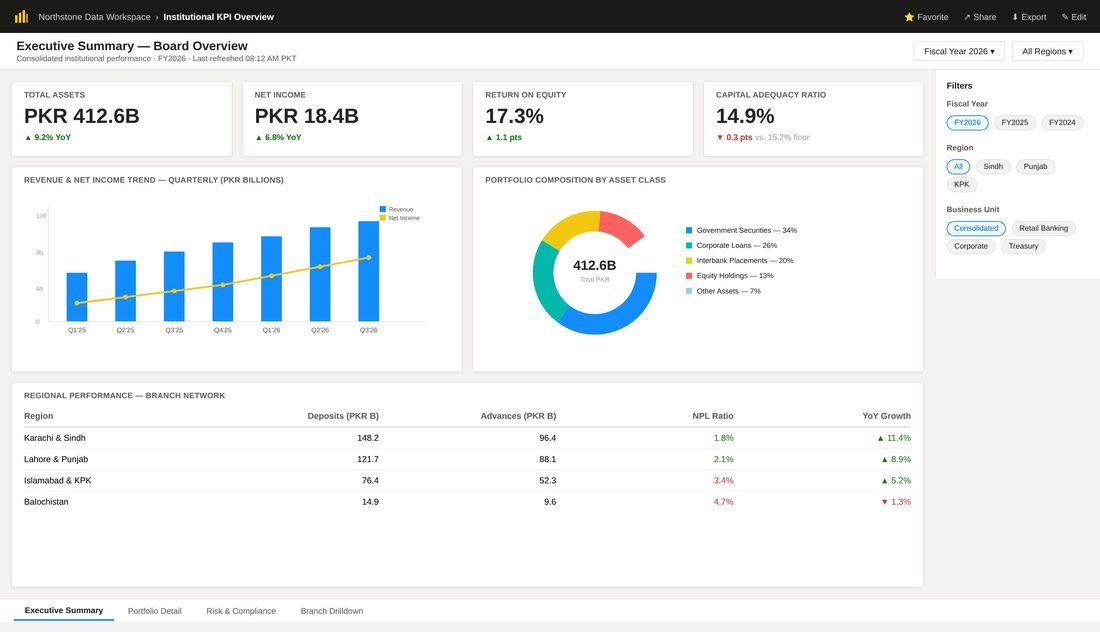
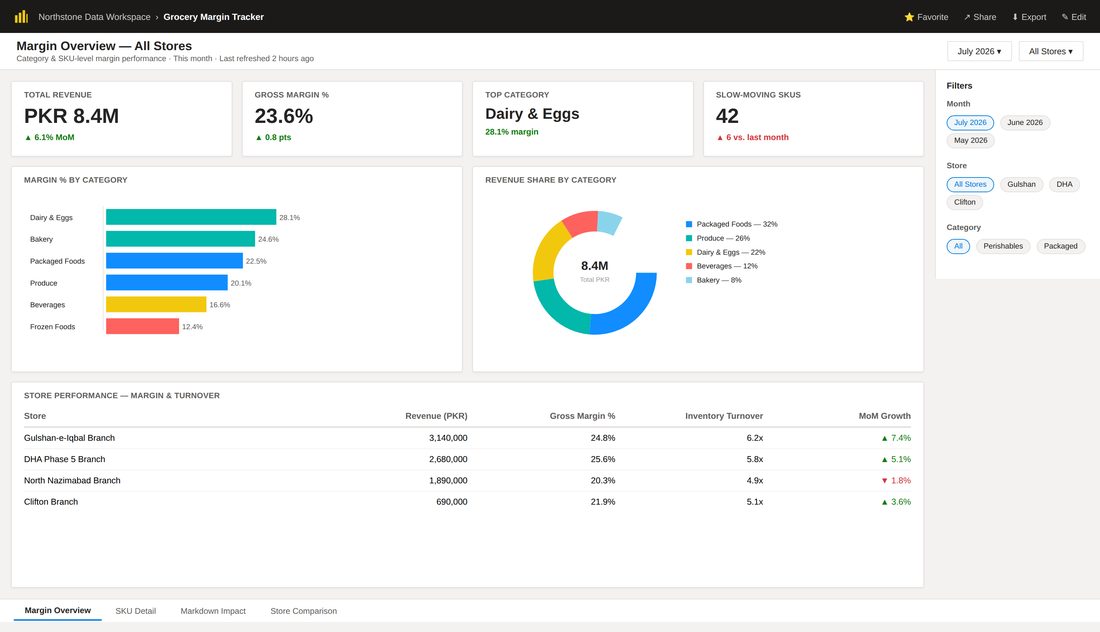
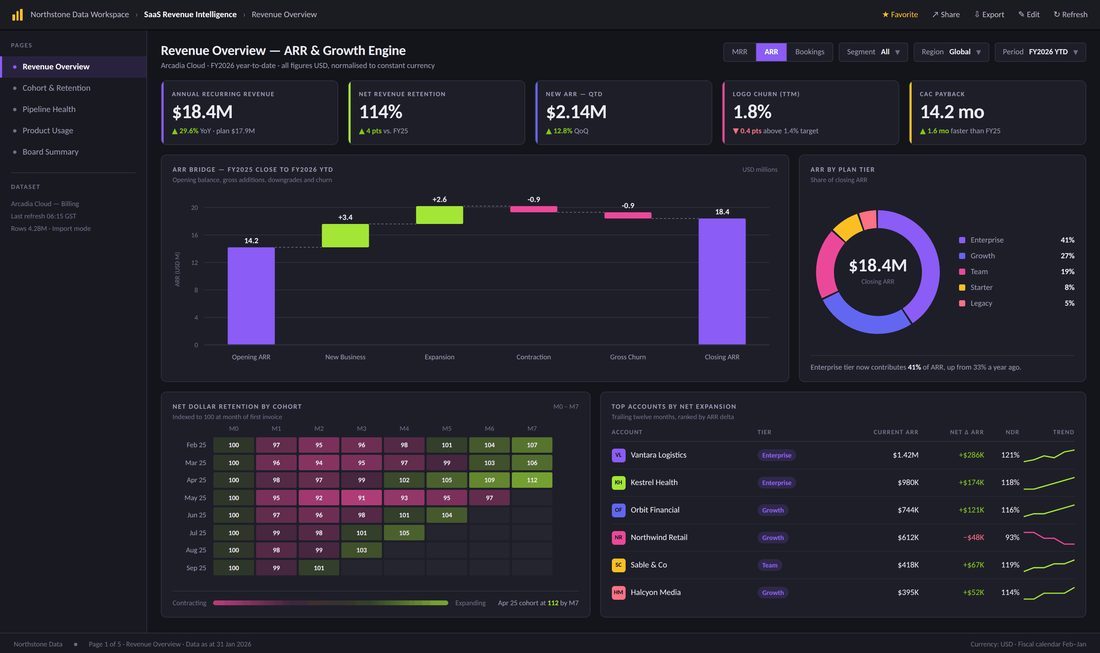
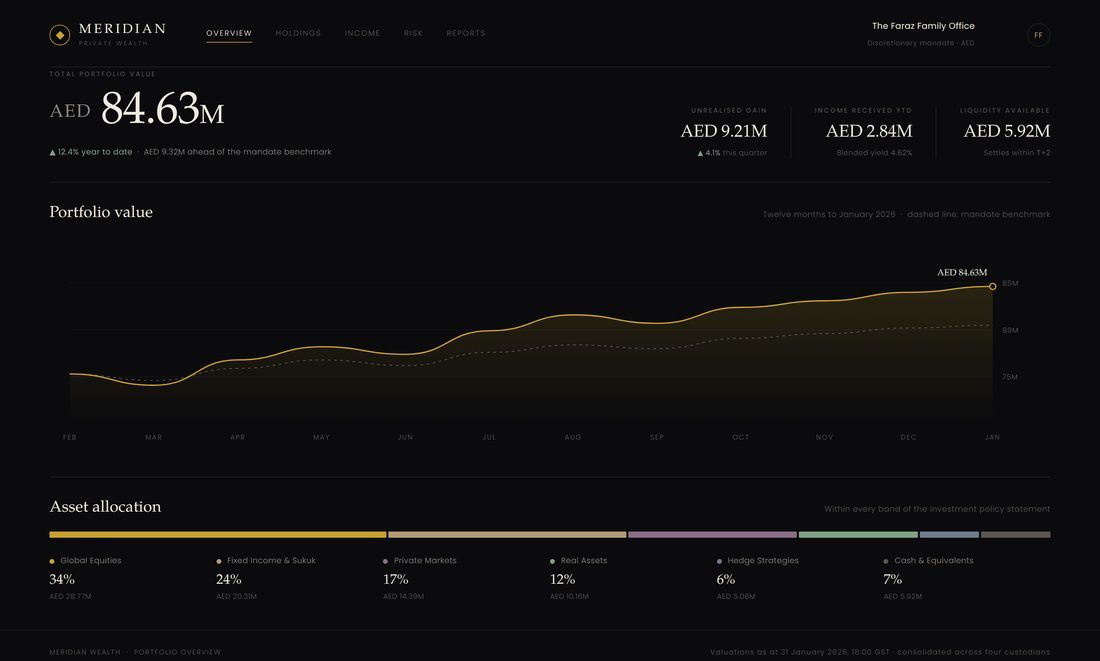
We turn your Excel sheets or POS exports into live, elegant dashboards — with one-click PDF and slide reports built for whoever's in the room. For finance firms and for the shop on the corner.

A live preview — this is real KPI data updating as you switch industries, not a static image.

Finance View
Retail & Café View
What We Do

See it. Predict it. Decide on it.

Three stages of the same job. Most clients start at the first and climb — you don't need all three on day one.

01 — See

Dashboards

“What is actually happening?”

Your Excel sheets and POS exports turned into one live view you can read at a glance — revenue, margins, KPIs, updated as the data lands rather than at month-end.

See six we've built →
02 — Predict

Forecasting

“Where is this heading?”

A predictive layer on top of your dashboard — trend and seasonality modelling, confidence bands, and best/base/worst scenarios so you're planning against a range instead of a guess.

How forecasting works →
03 — Decide

Financial Modelling

“What happens if we do this?”

Your three statements linked into one engine, so you can change a driver and watch it travel all the way through to cash. Built for the decisions that don't have an obvious answer.

What's included →
Two Tracks, One System

Built for how your business already runs its numbers.

Same core engine — a parser, a live dashboard, one-click reporting — shaped around what your industry actually measures.

Finance & Institutions

For fintechs, banks & investment firms

Drop in an Excel sheet. Get a live dashboard with KPIs, trends, and forecasting — plus PDF reports and slide decks generated per audience, at the press of a button.

  • Excel-driven parsing, no manual re-entry
  • Financial forecasting & trend modelling
  • Audience-specific report & slide generation
  • HTML or Power BI, your choice
Book a Consultation
Retail & Hospitality

For cafés, restaurants, retail & grocery

Connects to the POS system you already use. See daily sales, top items, and margins clearly — without asking staff to compile a single spreadsheet.

  • Works with your existing POS data
  • Daily, weekly & monthly sales views
  • Top-sellers, margins & slow-stock tracking
  • Simple enough for non-technical owners
Book a Consultation
How It Works

Send a spreadsheet Monday. See your dashboard Wednesday.

No discovery phase, no proposal deck, no invoice before you've seen anything. Here is exactly what the first week looks like.

i.
Day 1 — Monday

We show you a demo, free

Send your Excel sheet or POS export. I build a working dashboard with data styled to your industry, so you see exactly what you'd be buying before spending a rupee or a dirham.

ii.
Day 3 — Wednesday

You approve the build

You look at a real dashboard, not a mockup in a proposal. Like it? I rebuild it around your actual KPIs and branding — that's the point where the engagement, and any payment, begins.

iii.
Day 4 onward

Your data stays yours

The dashboard runs on your own machine or hosting. You drop in your Excel or connect your POS — we never hold or store your numbers.

iv.
Every month after

Report with one click

Generate a PDF or slide deck for any audience — board, investors, ops team — instantly, formatted and ready to send.

See The Cost Of Doing It Manually

How much is manual reporting actually costing you?

Move the sliders — this updates live based on your own numbers, not ours.

People handling reporting 2
Hours/week spent pulling & compiling data (per person) 6
Average hourly cost (AED) 80
Estimated cost of manual reporting
AED 3,840/month
That's roughly AED 46,080 a year — and 48 hours a month your team could spend on actual analysis instead.

Estimate only — actual savings depend on your specific workflow.

Your data never leaves your device
HTML or Power BI, your choice
One-click PDF & slide exports
Free demo before you commit
How We Handle Your Data

Built to be trusted with numbers that matter.

Row-Level Security

Dashboards can be scoped so each viewer only sees the data relevant to their role — a regional manager doesn't see company-wide financials unless you want them to.

Zero Manual Data Entry

Once connected, your dashboard pulls directly from your Excel, POS, or accounting export — nobody's retyping numbers, so nobody's introducing typos.

Automated Data Pipelines

New data drops in, the dashboard updates. No monthly manual refresh, no waiting on someone to "send the latest file."

You Talk To Whoever Builds It

No account manager, no handoff to a junior after you sign. The person you message on WhatsApp is the person writing the code — which is why fixes take hours rather than a support ticket cycle.

Built For This Market

PKR and AED side by side, UAE VAT handled correctly, Ramadan and Eid seasonality treated as the reality it is rather than an anomaly to smooth out. Built here, for how business is actually done here.

Runs On Your Infrastructure

Your dashboard lives on your machine or your hosting, not ours — we never hold or store your raw financial data.

Works with the tools you already use:
Excel Power BI QuickBooks Xero SQL Server POS Exports
New — Forecasting

See where your numbers are headed, not just where they've been.

A predictive layer on top of your dashboard — trend modelling, scenario testing, and confidence-scored projections. Currently shown as a preview; built into your real dashboard once you approve it.

FORECAST ENGINE · PREVIEW
● LIVE MODEL · 92.4% HISTORICAL ACCURACY
Forecasted Revenue — Q4
AED 1.94M
▲ 8.6% vs. base case
Growth Rate (Projected)
+11.2%
▲ QoQ
Model Confidence
92.4%
▲ 1.1 vs last cycle
Variance vs. Prior Forecast
2.3%
▼ tightening
Revenue Forecast — Actual vs. Projected
Solid = historical actuals · Dashed = forecast · Shaded = confidence band
Feb May Aug — today Jan
Scenario Controls
Seasonal Demand+12%
Cost Inflation+4.5%
New Location AddedOff
Model Notes
Method: trend + seasonality regression, 24-month training window.
Q4 assumes 11.2% growth — above historical max of 9.8%. Flagged for review.

Scenario Analysis

Every forecast ships with three cases side by side, so you're never looking at just one number.

Worst Case
AED 1.68M
-13.4% vs. base — demand softens, costs rise
Best Case
AED 2.21M
+13.9% vs. base — seasonal demand holds strong
01

Drop your Excel file

Drag and drop directly onto the dashboard — the parser reads your columns automatically.

02

Confirm what we found

A quick preview shows the data mapped correctly before anything is generated.

03

Forecast generates instantly

Trends, growth projections, and confidence bands populate live — ready to explore or export.

i.

What you're seeing is the foundation, not the finished build.

This preview shows the core forecasting layer — KPIs, trend chart, scenario analysis. Your actual dashboard goes further, shaped around your specific business: additional metrics, industry-specific drivers, and report formats built around what you actually need to track. This is the starting point of that conversation, not the ceiling.

Decide — Financial Modelling

Change one number. Watch it reach your cash balance.

A dashboard tells you what happened. A forecast tells you what's likely. A model tells you what happens if — and that's the one you need before a decision you can't reverse.

  • Three linked statements. Income statement, balance sheet and cash flow wired together properly — so the balance sheet balances, and every assumption ends up somewhere real instead of in a disconnected tab.
  • Driver-based scenarios. The model is built on the handful of assumptions that actually move your business — acquisition cost, churn, price, headcount, collection days. Change one and the whole model responds.
  • Runway and covenant answers. “What happens to our cash runway if CAC rises 15%?” stops being a two-day spreadsheet exercise and becomes a number you have in front of you.
  • Sensitivity analysis. Two-way tables showing which assumptions your outcome is genuinely fragile to — so you know which two or three numbers to actually watch.
  • Yours to keep and audit. Delivered as a documented Excel model with assumptions on a single input sheet, colour-coded and unlocked. No black box, no dependency on me to change a number.

Fixed scope, not a retainer

Three-Statement Model
AED 3,000–6,000
Linked statements, driver sheet, monthly build out to 36 months. Includes two revision rounds and a walkthrough call.
Model + Scenario & Sensitivity Suite
AED 6,000–11,000
Everything above plus scenario switching, sensitivity tables, and a dashboard front-end so non-finance readers can use it too.
Quarterly refresh (optional)
AED 500–900
Roll the model forward with actuals each quarter and re-base the assumptions. Per quarter, cancel anytime.
Scoped and quoted after one short call — a model is only as good as the decision it's built for, so I'd rather understand that first. Priced per build, not monthly, because a model is a deliverable you own.
Discuss a Model
Pricing

Simple setup fee. Small monthly upkeep.

Every engagement includes a free demo first. Figures below are starting points — every quote is finalised after a short consultation.

Café & Single-Location Retail

POS-connected dashboard for one location
Setup (one-time)AED 1,500–3,000
Monthly upkeepAED 200–400
  • POS integration & setup
  • Core sales & margin KPIs
  • Monthly support & fixes
Get a Custom Quote

Finance & Institutions

Multi-audience reporting & automation
Setup (one-time)AED 7,000–15,000
Monthly upkeepAED 1,000–2,000
  • Excel-driven automation
  • Audience-specific report builder
  • Dedicated ongoing support
Get a Custom Quote

Forecasting Add-On

Predictive layer added to any dashboard
Setup (one-time)AED 1,200–2,500
Monthly upkeepAED 250–500
  • Trend & seasonality modelling
  • Scenario & confidence-band views
  • Best paired with an existing dashboard
See Forecasting

Note: pricing reflects each market's own rate, not a straight currency conversion — figures adjust per region, not by exchange rate alone.

i.

You only pay once you're ready.

Every client sees a live demo dashboard first — built with sample data styled to your industry — before any payment is made. Once you're happy and want it built around your real business, that's when the engagement (and pricing above) begins.

Let's Talk

See your business, laid out clearly.

Book a short call — we'll show you a demo dashboard styled to your business before you decide anything.

Founder photo
About

I got tired of watching good businesses run on guesswork.

I'm Abdul. I help business owners and finance teams spot exactly where their money's going in real time — no finance degree, no full-time analyst on payroll. I do that by building dashboards: the kind that take a messy Excel sheet or a POS export and turn it into something you can actually read at a glance.

It started with financial automation work — building HTML and Power BI dashboards for firms that needed forecasting, KPI tracking, and reporting that didn't take a full-time analyst to produce. Somewhere along the way I realised the same problem exists everywhere, not just in finance: the café owner squinting at a POS export at midnight has the same headache as a CFO buried in spreadsheets. Different scale, same frustration.

Before this became its own thing, I spent time freelancing directly with clients on automation and dashboard projects — which is where I actually learned the difference between a dashboard that looks impressive in a pitch and one a business owner opens every single morning without being told to.

So now I build both — automated financial dashboards for firms in Pakistan and the GCC, and simpler, POS-connected dashboards for the shops, cafés, and retailers who just want to know what's actually happening in their business without doing the math themselves. Every dashboard starts the same way — a real conversation about what you actually need to see, not a template I try to make fit.

Let's Talk

Reach out directly — whichever's easiest.

Email
abdul@northstonedata.com
WhatsApp